Intro
 I am a Data Analyst passionate about transforming complex data into strategies that solve real business problems. With expertise in SQL, Power BI, Excel, Python, and more, I specialize in uncovering insights, optimizing performance, and guiding decision-making with data.
RAG Chatbot
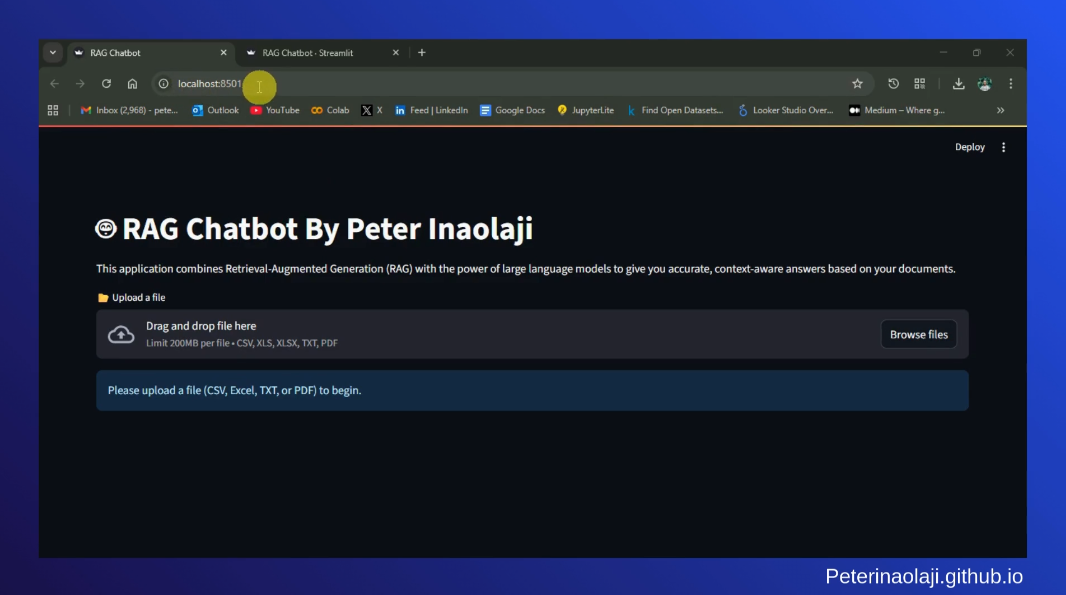
An AI-powered RAG chatbot that helps users analyze and summarize data.
Developed an interactive chatbot that lets users query their datasets (CSV, TXT, PDF) in natural language.
Powered by Hugging Face, FAISS, and transformer models, and deployed on Streamlit for simple, accessible use.
Click on image to interact.
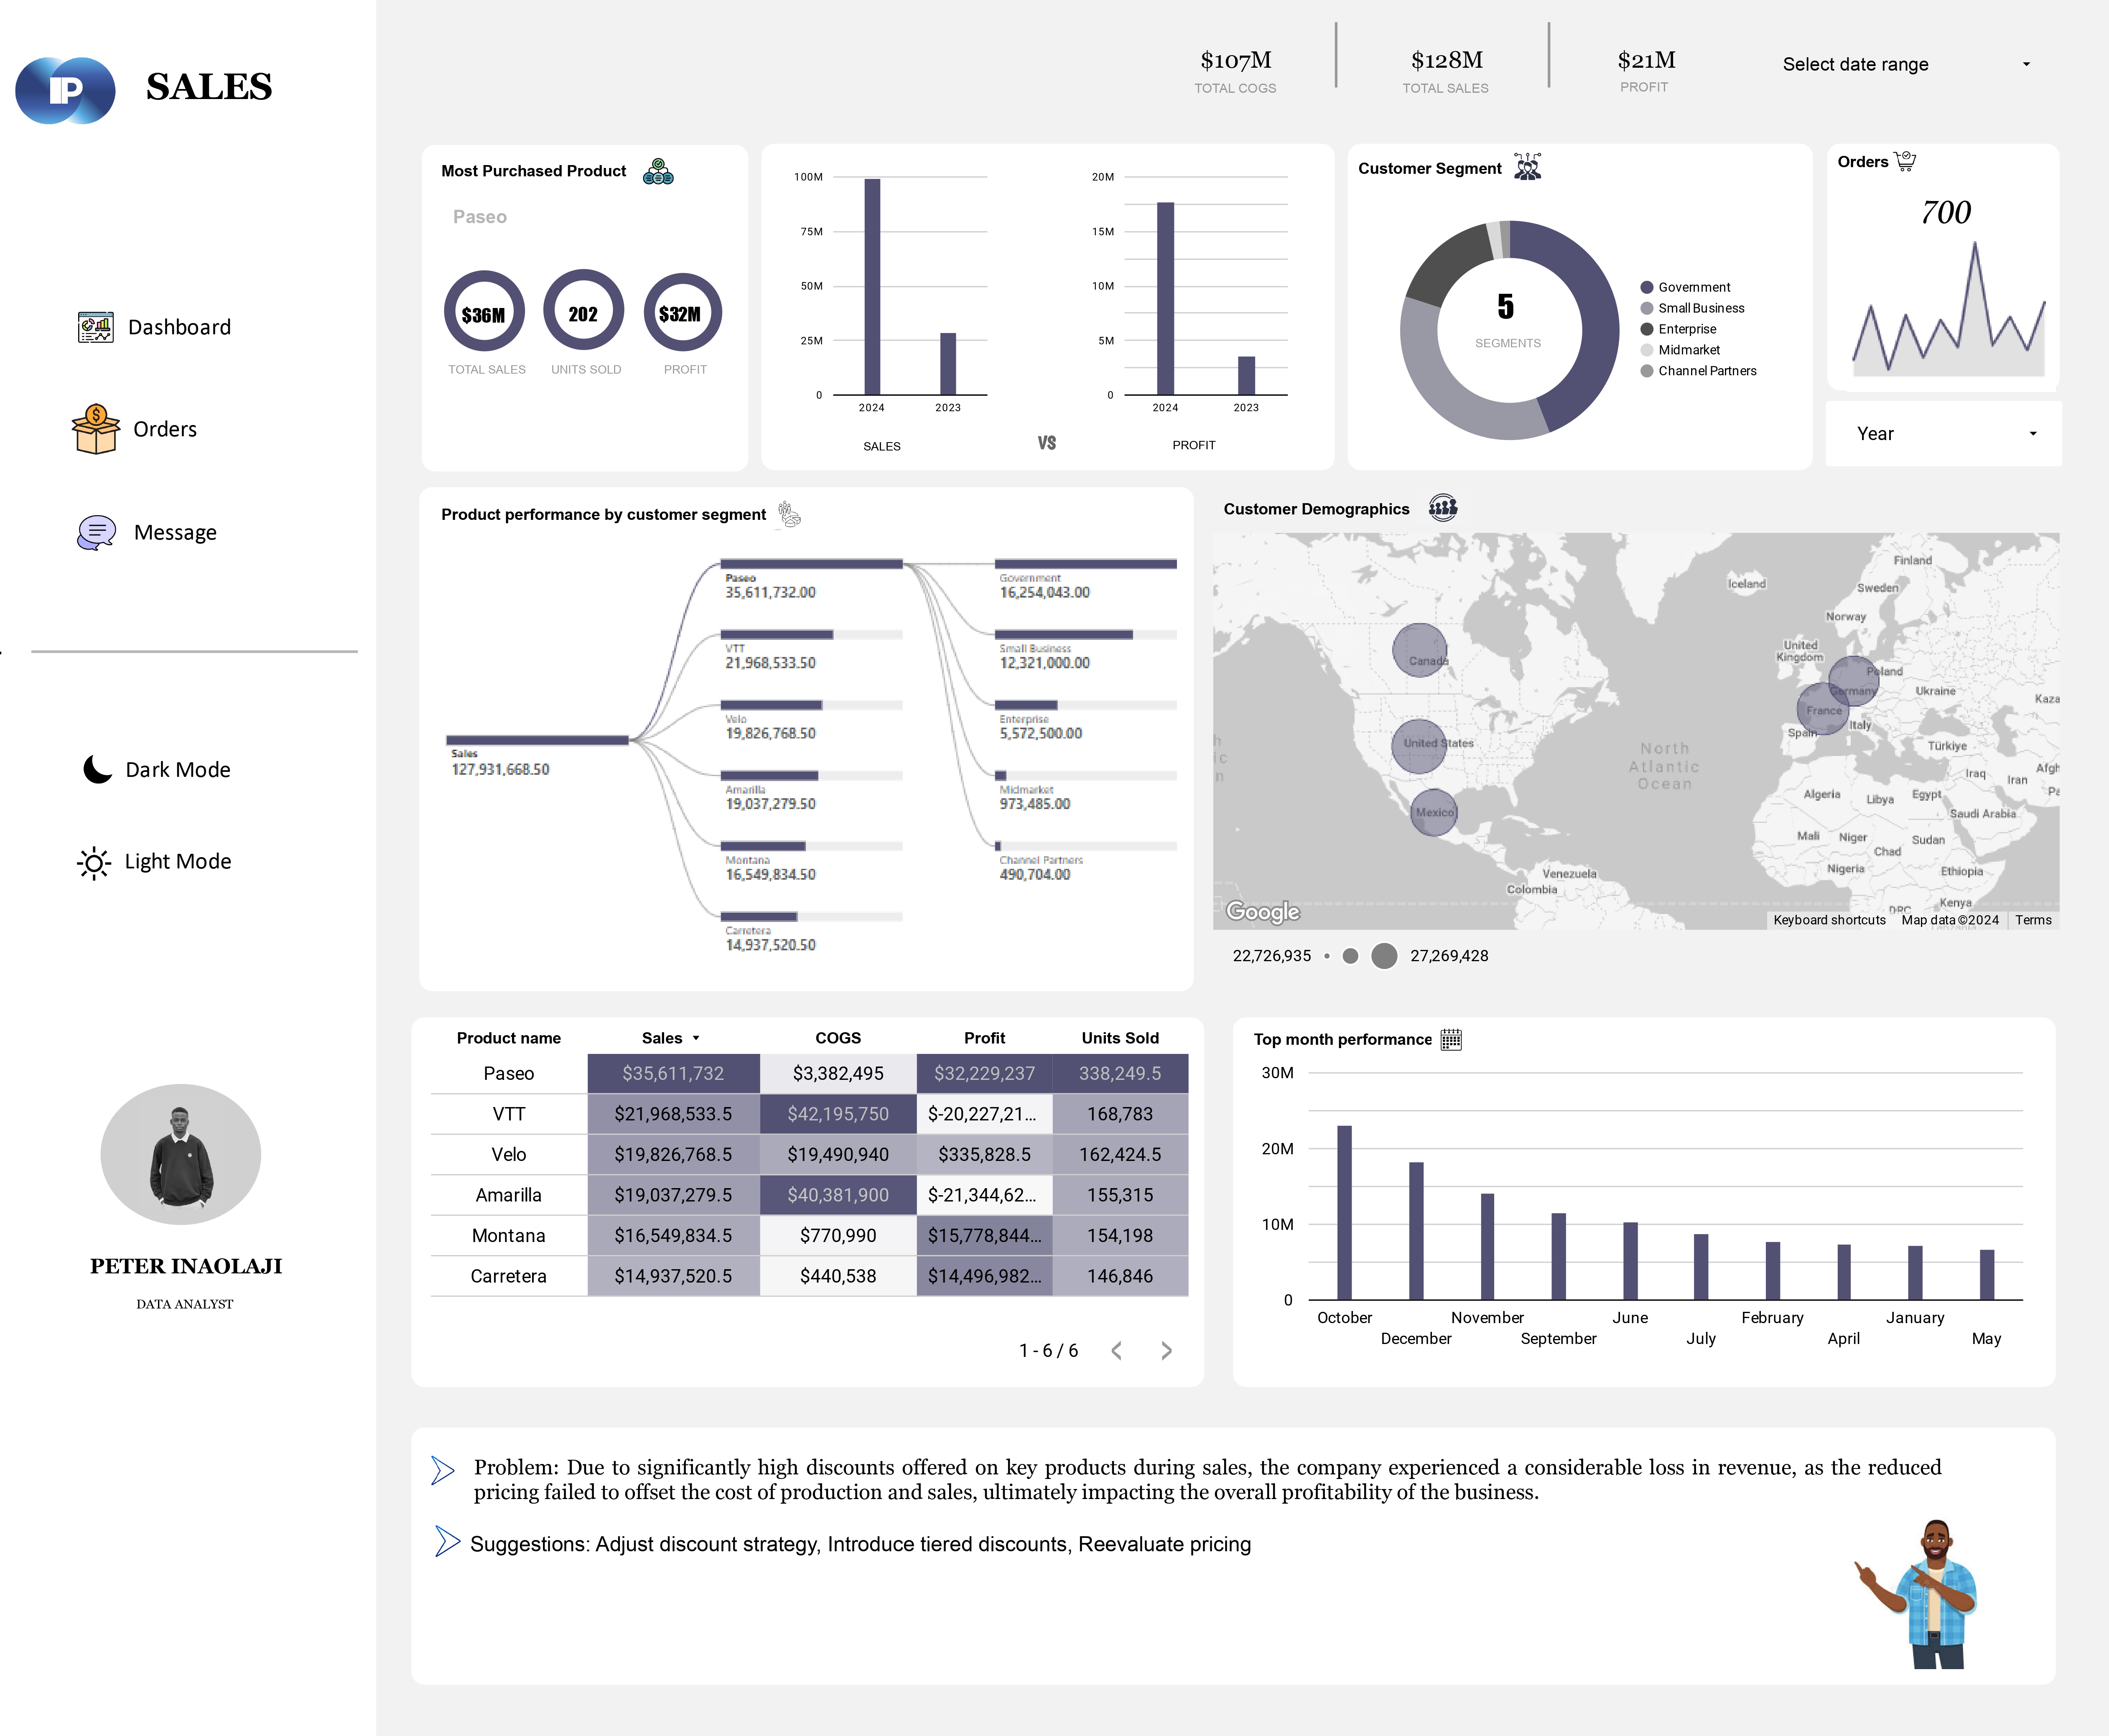
Sales and Profit Performance
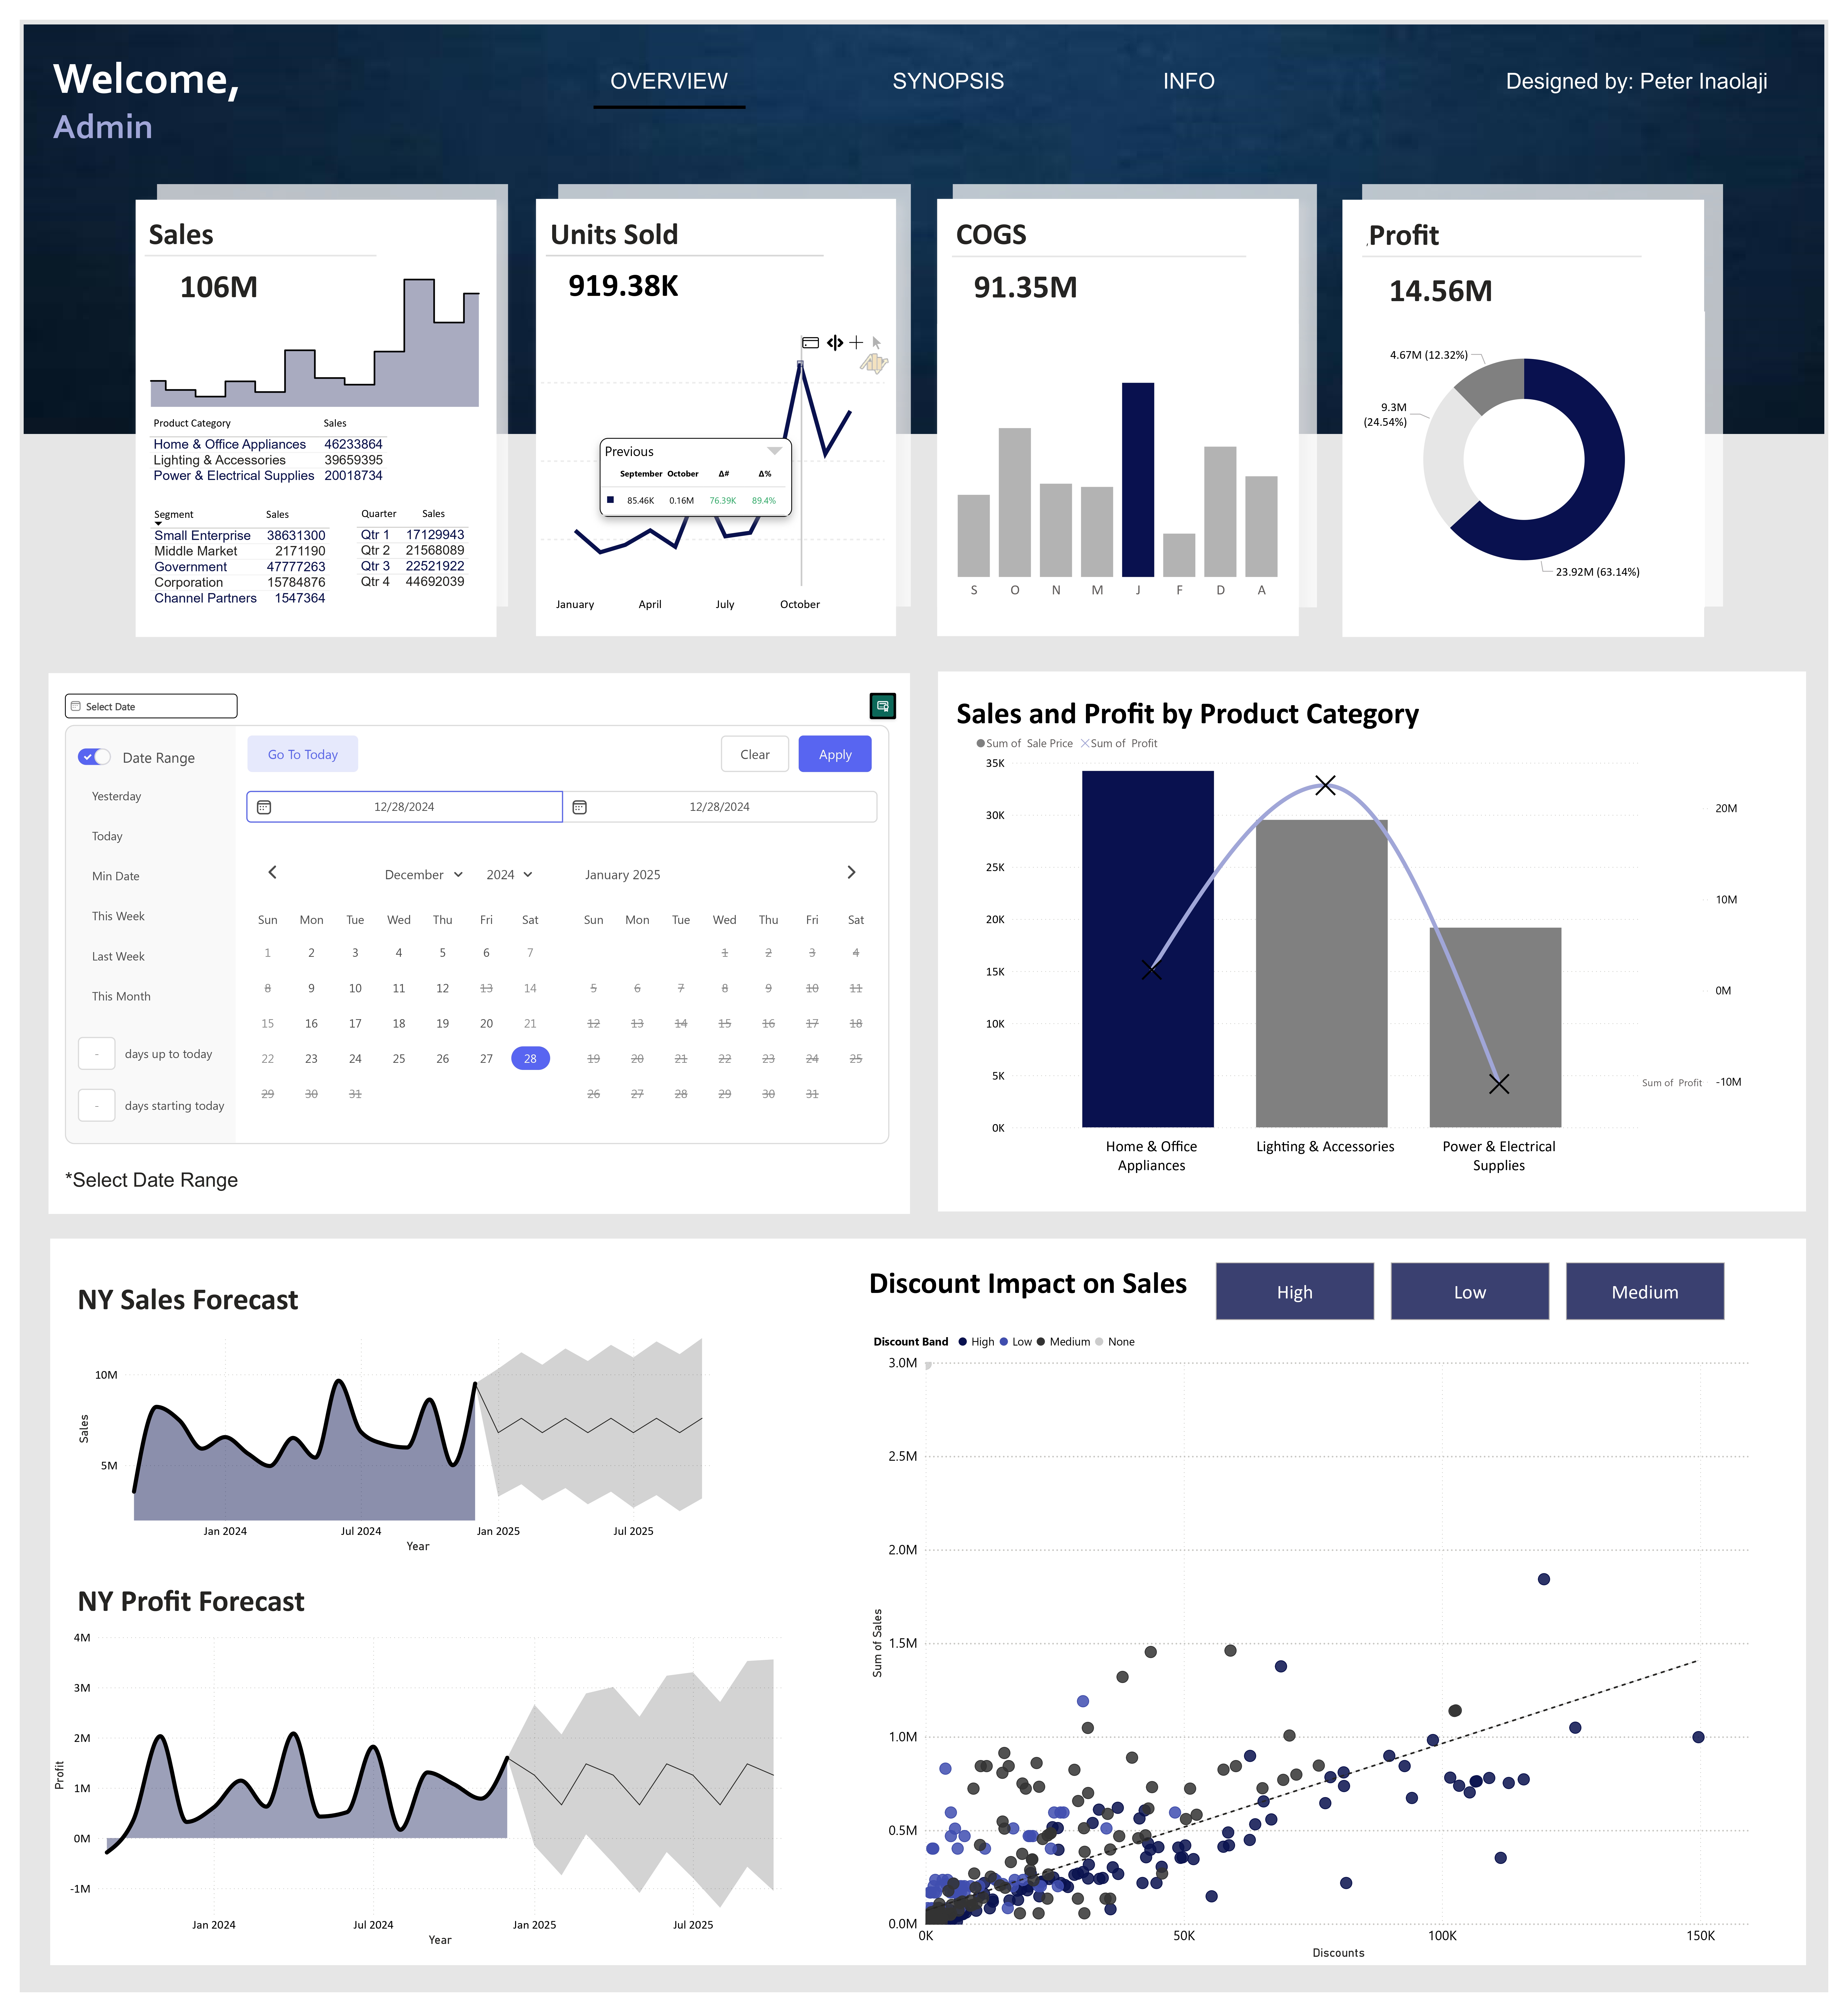
Aimed at tracking company sales and profit performance
Applied several Data Analysis Expressions (DAX) in Power BI to make this two-paged dashboard dynamic. It tracks sales and profit over time.
Click on image to interact.
Hospital Performance Report
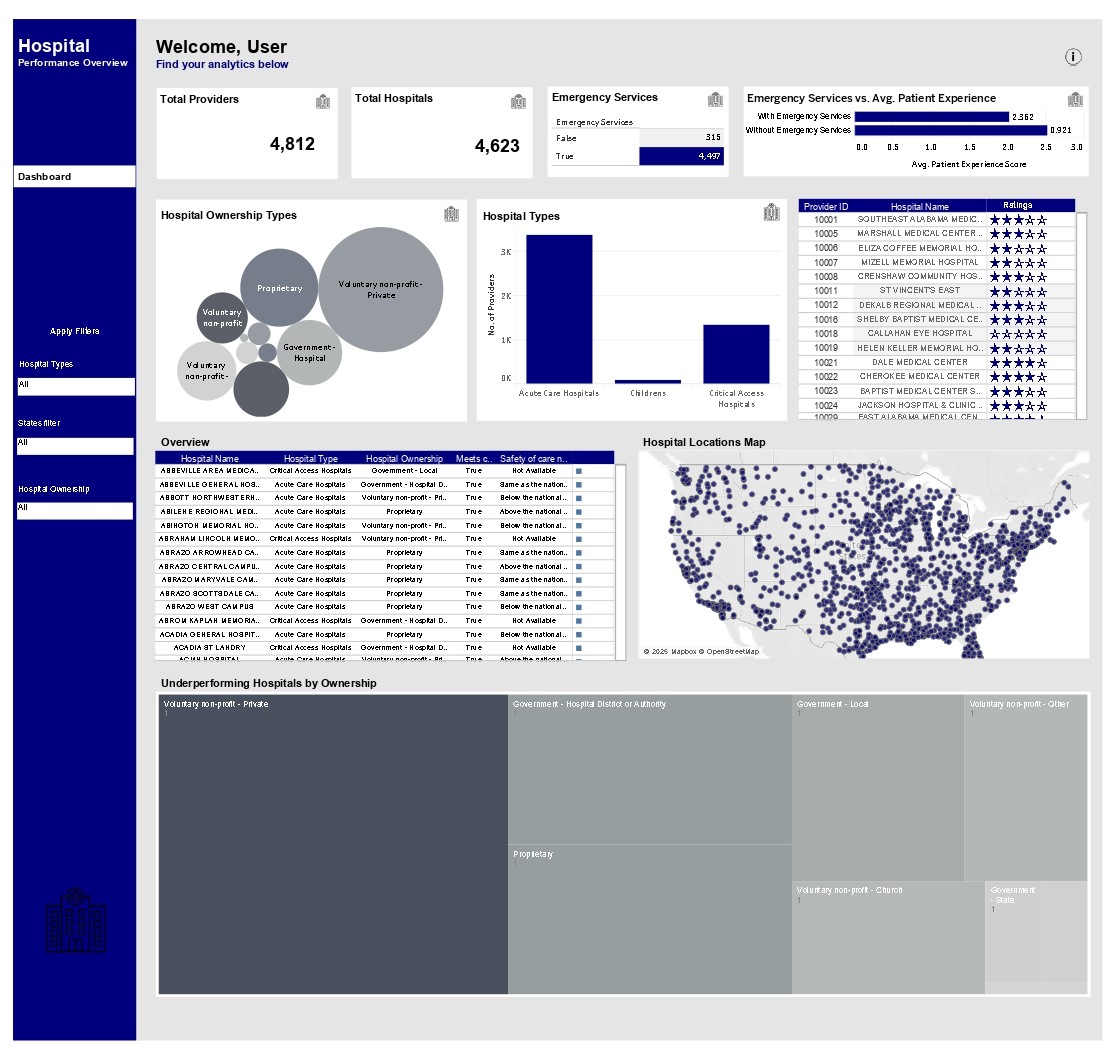
Bulit with Tableau
This analysis explores the landscape of hospital facilities and service performance across the United States, focusing on availability, ownership, service quality, effectiveness, and patient experience. The goal was to uncover patterns in hospital distribution, effectiveness, and satisfaction, and to highlight areas where improvements may be needed through visual and data-driven exploration.
Click on image to interact.
Financial Insights Dashboard
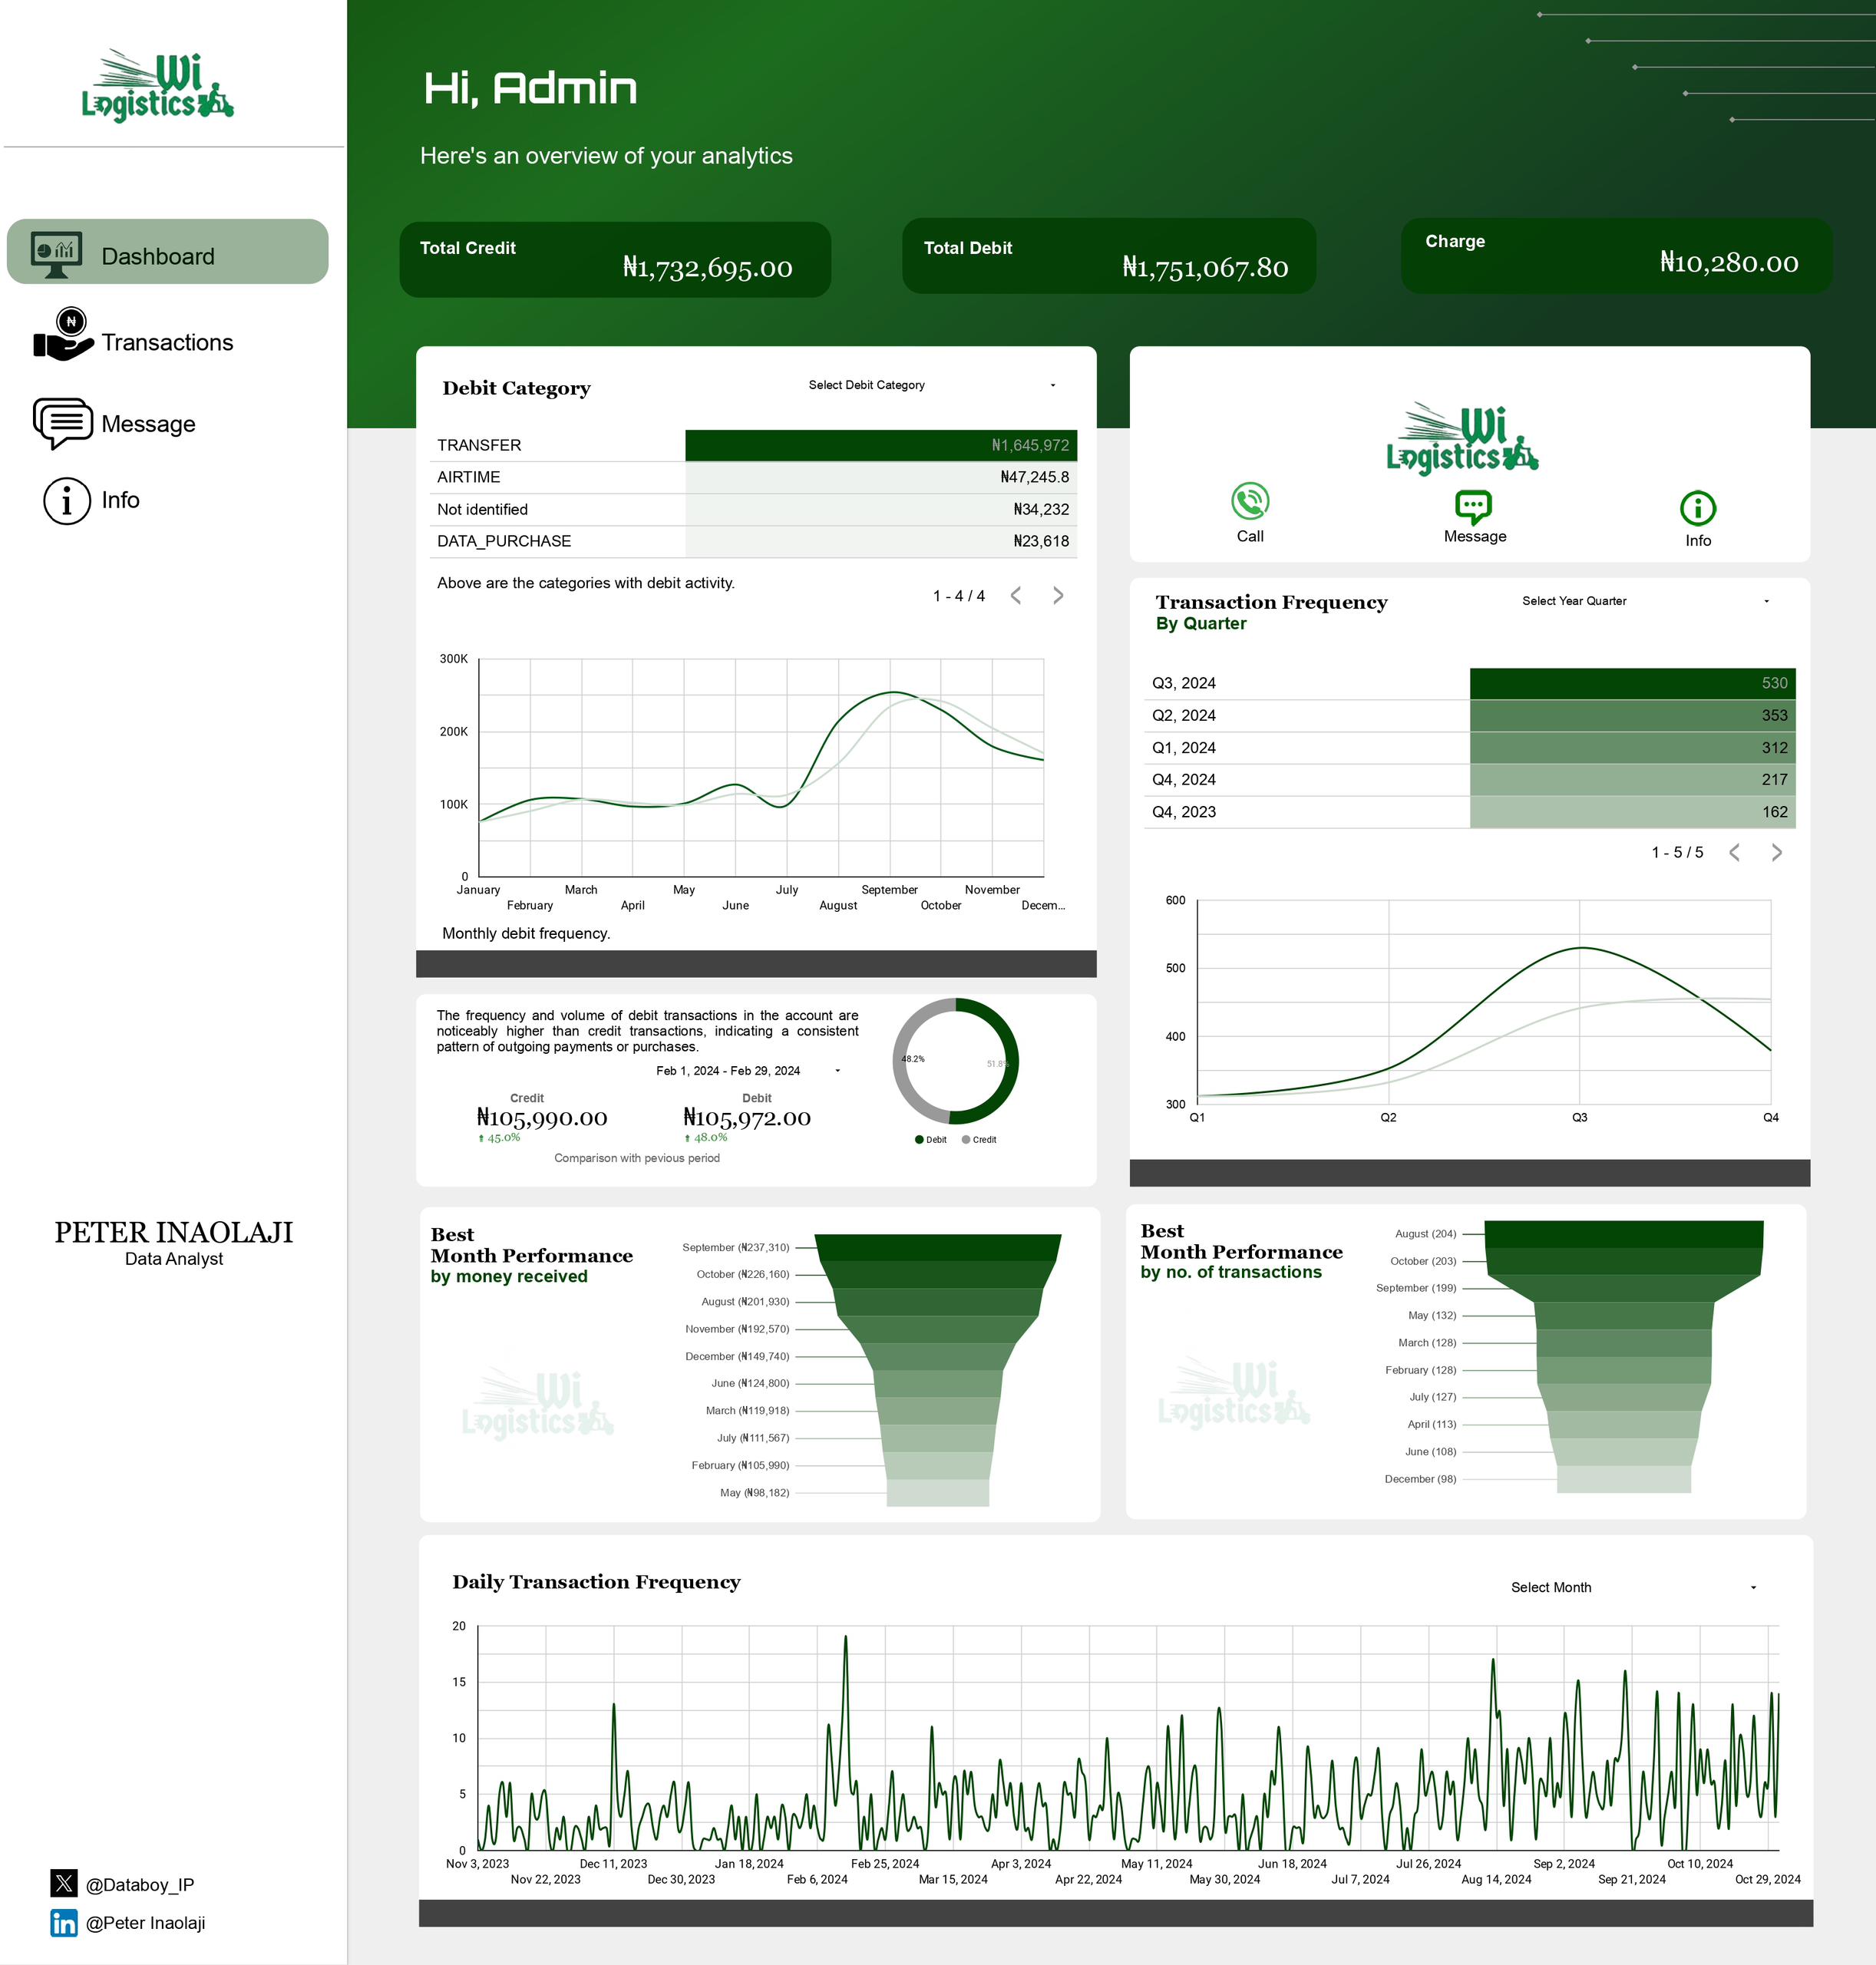
Visualization of transactions data of a logistics company.
This project involved analyzing and visualizing transactional data from the bank statements of a logistics company. The goal was to extract key financial insights, such as revenue trends, expense breakdowns, cash flow patterns, and profit margins.
Click on image to interact.
Sales Performance Tracker
This helps to monitor Trends and Key Performance Indicators effectively.
A sales performance tracker designed to capture key metrics. This helps to monitor trends and kPIs effortlessly and adjust strategies. Developed with Google Lookerstudio. To enhance user experience, I’ve included both light and dark mode options, catering to individual preferences.
Click on image to interact.
Covid-19 Publications Report
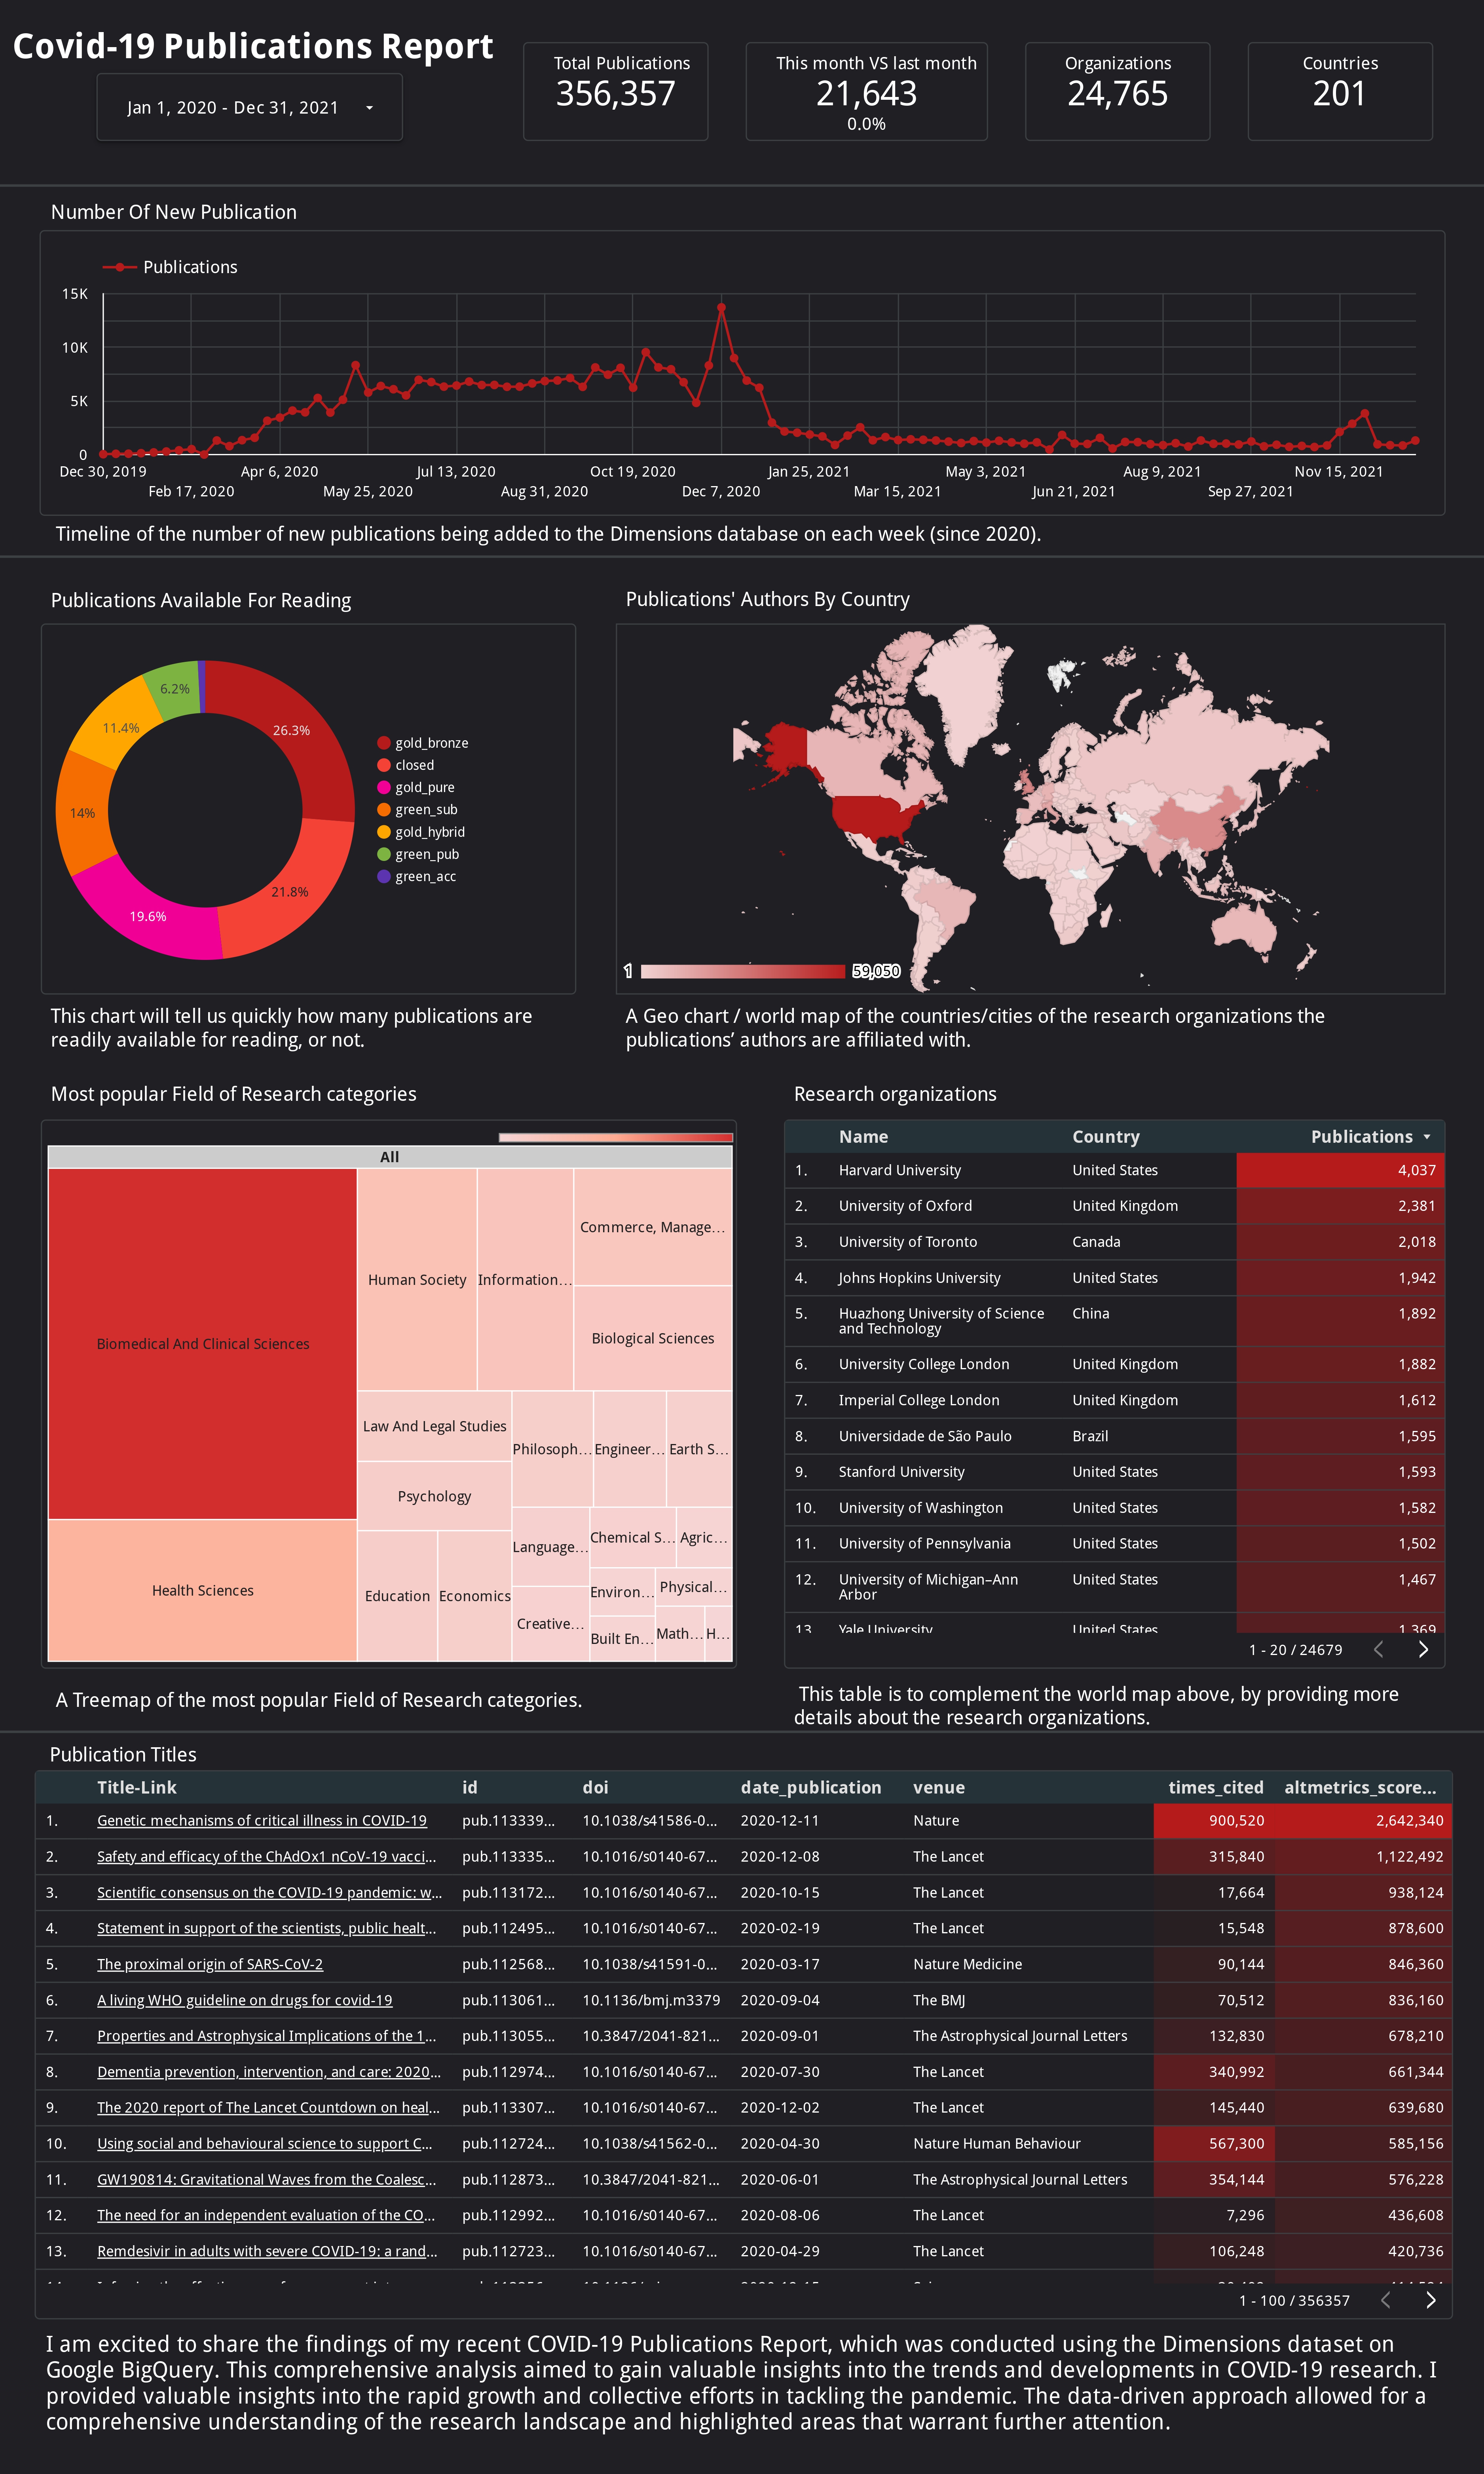
This is a project on Covid-19 book Publications.
I analyzed all articles and preprints, clinical trials, grants and datasets from Dimensions.ai that are related to COVID-19 in Google BigQuery using SQL. Utilized Google lookerstudio to create a visually appealing and informative report.
Click on image to interact.
Allocation Of Funds In Nigeria
_page-0001.jpg)
This project highlighights the allocation of monetary funds across states in Nigeria.
I fetched data from the FAAC official website into a google sheet where i made analysis of my data. Utilizing looker studio, i built visuals which shows the key metrics of how funds are distributed. This is an effort to contribute to transparency in the country.
Click on image to interact.
Hospital Case Types
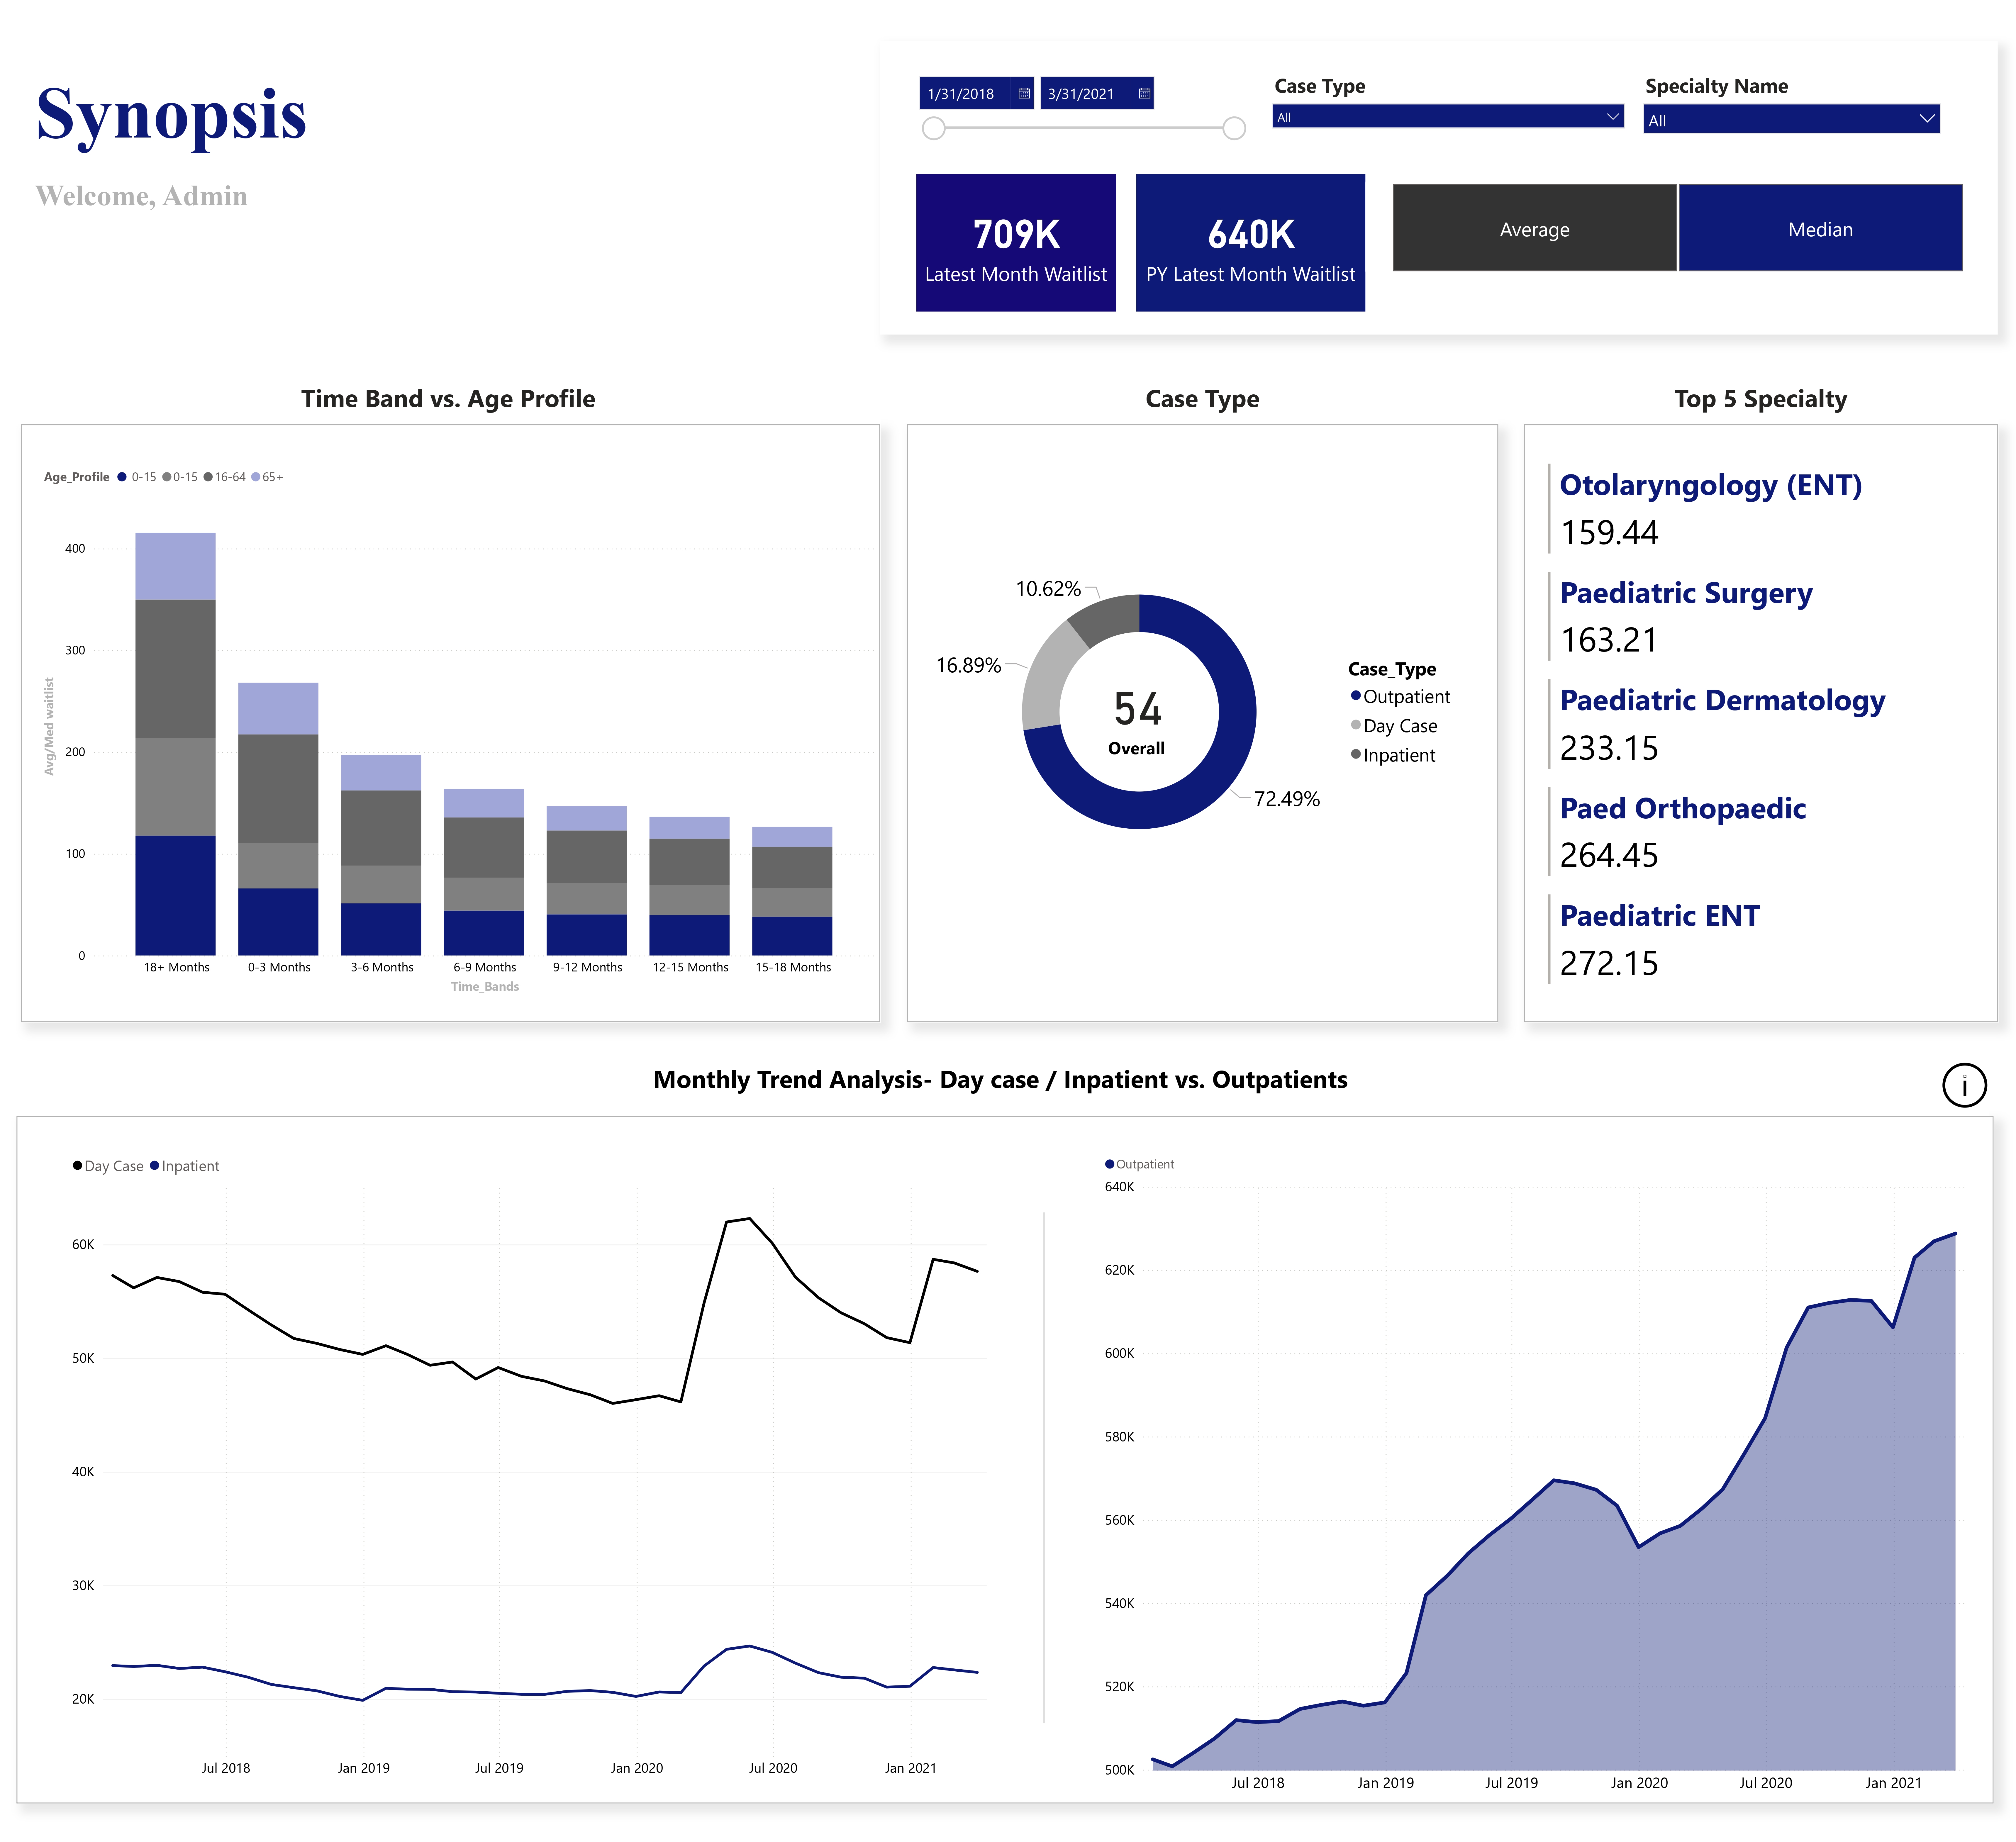
This project highlights the types of health related cases over a period of time.
This dashboard helps highlight the types of cases, the amount, specialty type, and many more, over a period of time. This three-paged report consists of the "Synopsis" page, "Detailed view" page and "Drilldown" page which is used as a tooltip. They provide detailed and summarized information.
Click on image to interact.
Influential Nigerian Actors
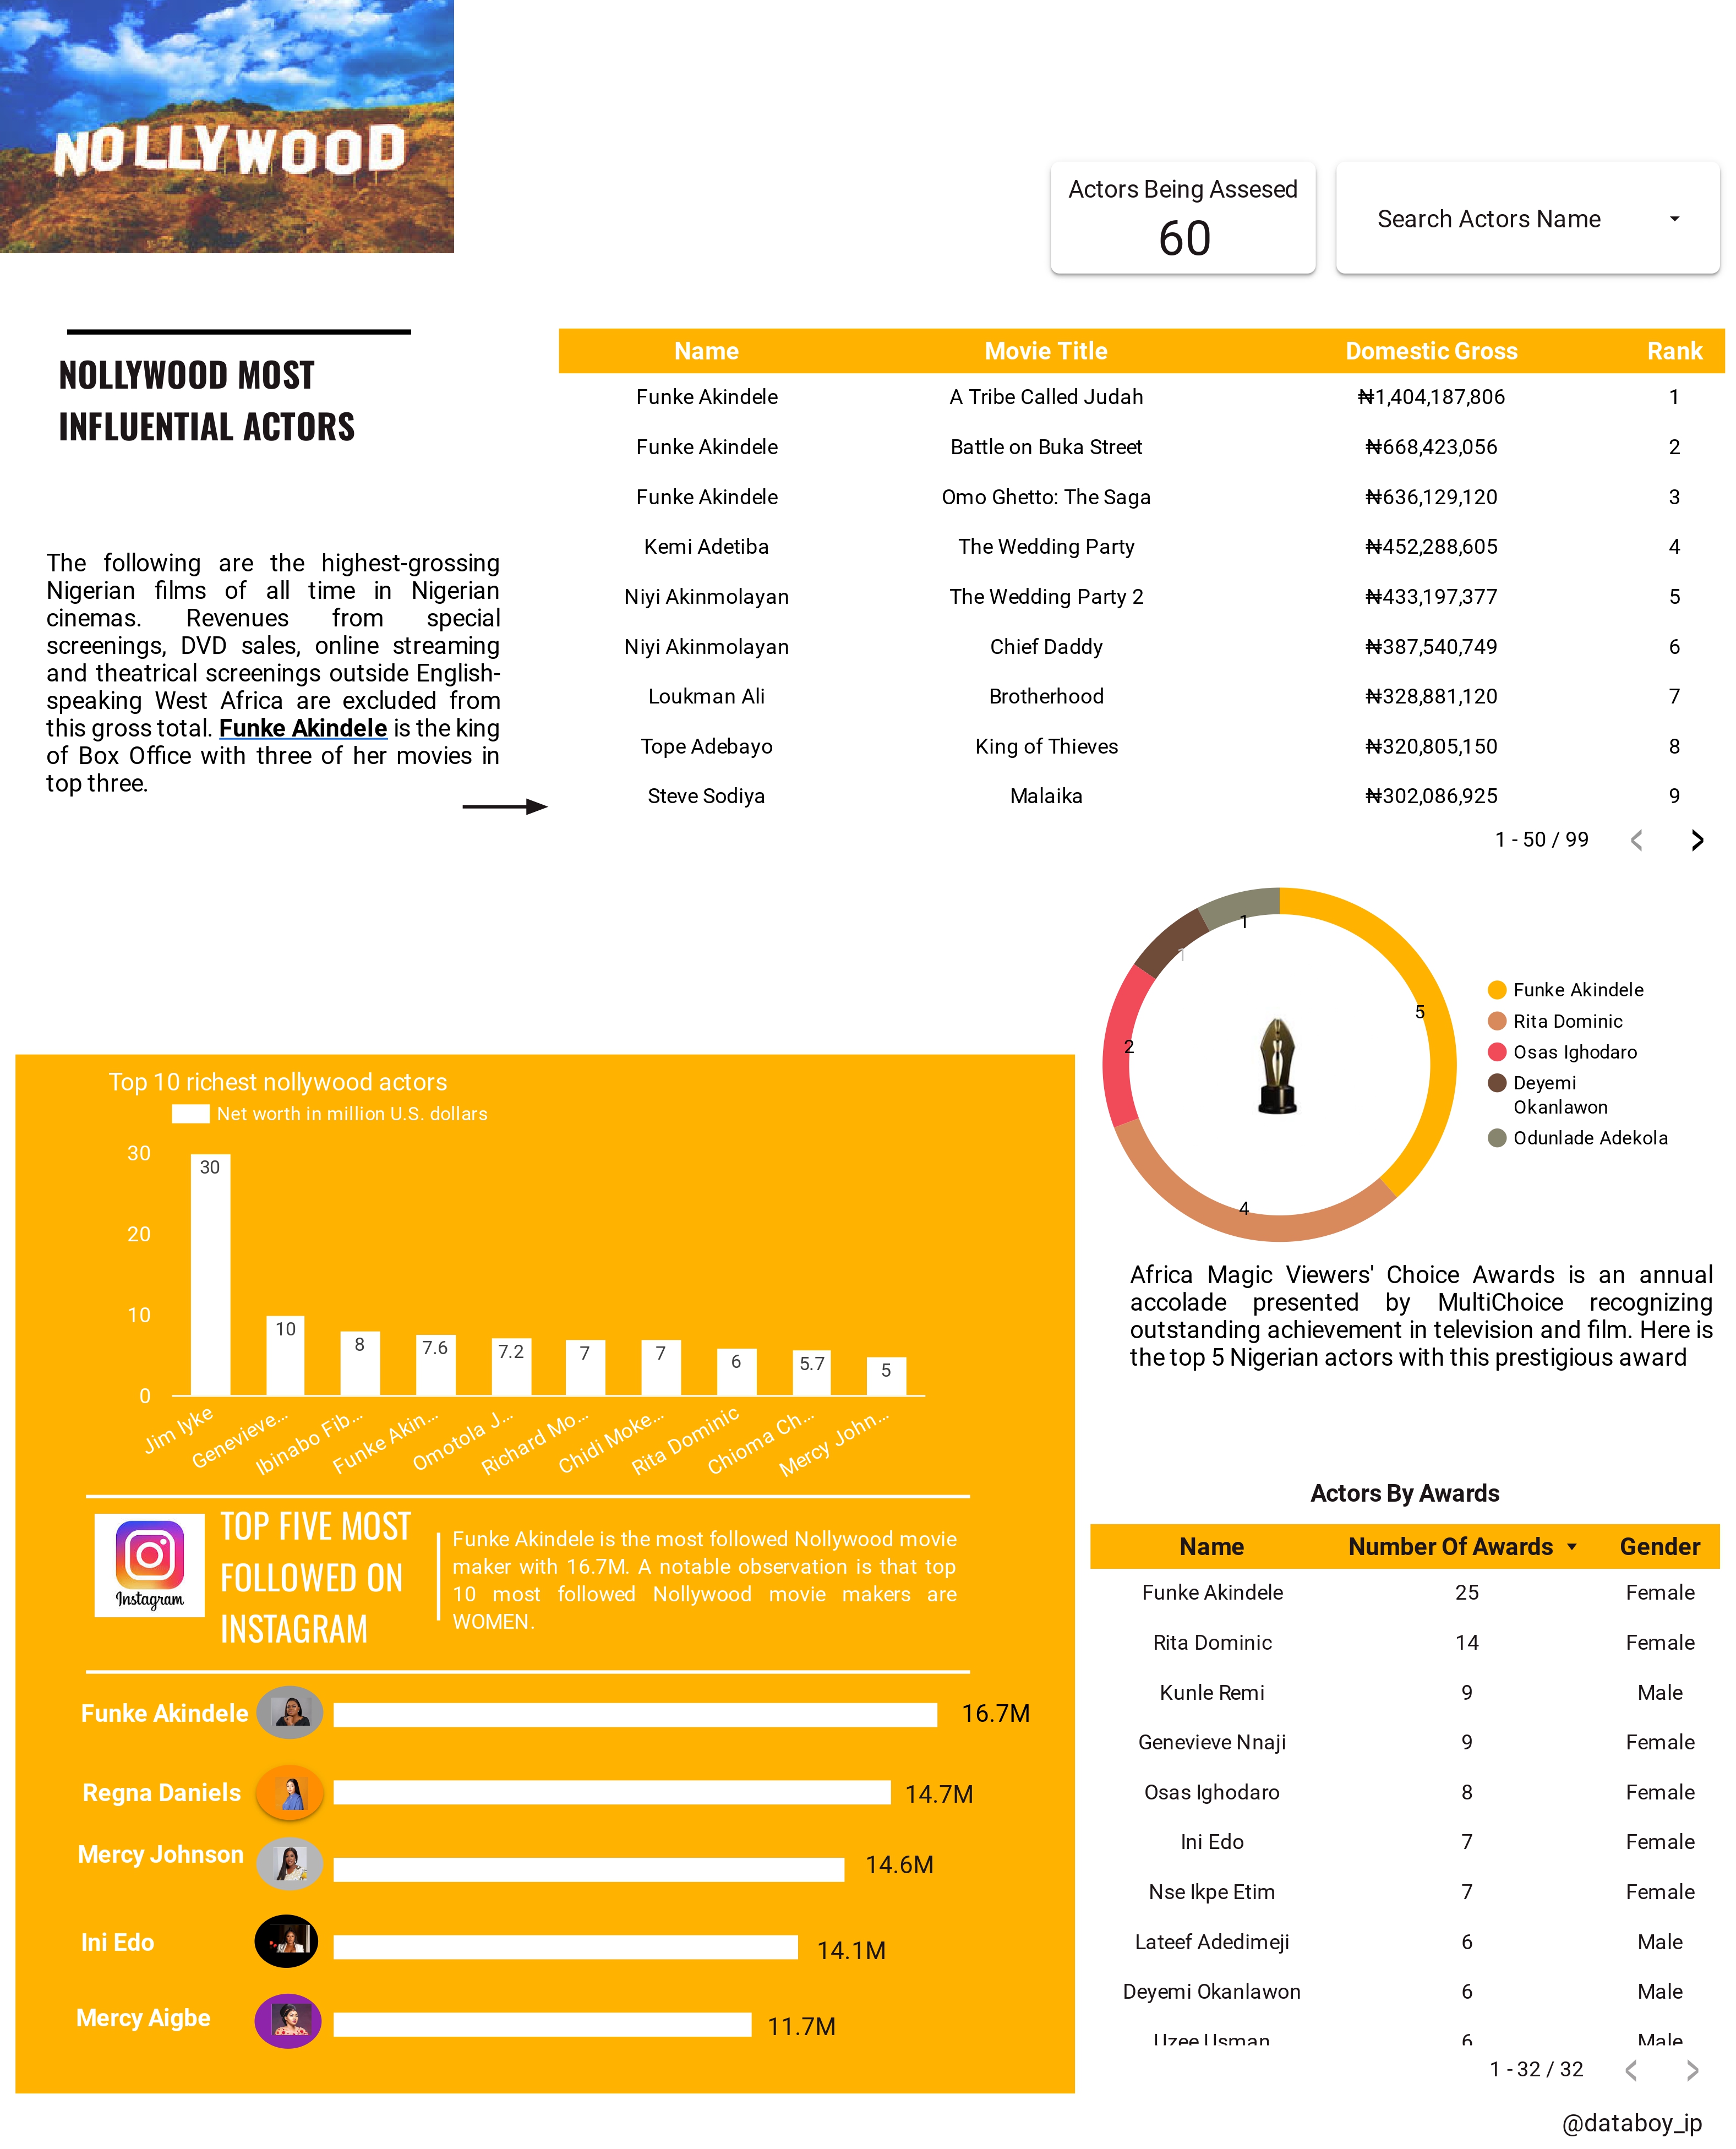
This is a project on Nollywood's most influential actors.
I created a project showcasing the most influential Nollywood actors, ranking them based on key metrics like the number of prestigious awards won. Using my web scraping skills, i gathered the data and built an appealing report using Lookerstudio.
Click on image to interact.
About

My name is Peter Inaolaji, a passionate data scientist and analyst. My goal is to uncover hidden insights from data and help businesses make data driven decisions. I hold multiple data analytics certifications from top global companies including KPMG, Deloitte, and Cisco.
My projects showcase my ability to extract valuable insights from large datasets and present them in a visually appealing and understandable manner. I am open to new opportunities and collaborations, please feel free to reach out to me.
Email: peteradeolu112@gmail.com
View My Resume.
Contact
View My Resume
Email: inaolajipeter0@gmail.com
Elements
Text
This is bold and this is strong. This is italic and this is emphasized.
This is superscript text and this is subscript text.
This is underlined and this is code: for (;;) { ... }. Finally, this is a link.
Heading Level 2
Heading Level 3
Heading Level 4
Heading Level 5
Heading Level 6
Blockquote
Fringilla nisl. Donec accumsan interdum nisi, quis tincidunt felis sagittis eget tempus euismod. Vestibulum ante ipsum primis in faucibus vestibulum. Blandit adipiscing eu felis iaculis volutpat ac adipiscing accumsan faucibus. Vestibulum ante ipsum primis in faucibus lorem ipsum dolor sit amet nullam adipiscing eu felis.
Preformatted
i = 0;

while (!deck.isInOrder()) {
    print 'Iteration ' + i;
    deck.shuffle();
    i++;
}

print 'It took ' + i + ' iterations to sort the deck.';
Lists
Unordered
- Dolor pulvinar etiam.
- Sagittis adipiscing.
- Felis enim feugiat.
Alternate
- Dolor pulvinar etiam.
- Sagittis adipiscing.
- Felis enim feugiat.
Ordered
- Dolor pulvinar etiam.
- Etiam vel felis viverra.
- Felis enim feugiat.
- Dolor pulvinar etiam.
- Etiam vel felis lorem.
- Felis enim et feugiat.
Icons
Actions
Table
Default
| Name |
Description |
Price |
| Item One |
Ante turpis integer aliquet porttitor. |
29.99 |
| Item Two |
Vis ac commodo adipiscing arcu aliquet. |
19.99 |
| Item Three |
Morbi faucibus arcu accumsan lorem. |
29.99 |
| Item Four |
Vitae integer tempus condimentum. |
19.99 |
| Item Five |
Ante turpis integer aliquet porttitor. |
29.99 |
|
100.00 |
Alternate
| Name |
Description |
Price |
| Item One |
Ante turpis integer aliquet porttitor. |
29.99 |
| Item Two |
Vis ac commodo adipiscing arcu aliquet. |
19.99 |
| Item Three |
Morbi faucibus arcu accumsan lorem. |
29.99 |
| Item Four |
Vitae integer tempus condimentum. |
19.99 |
| Item Five |
Ante turpis integer aliquet porttitor. |
29.99 |
|
100.00 |